
Solvency
Equity ratio
Description
The equity ratio is a financial structure metric indicating the proportion of equity relative to the total capital invested in the company’s operations.
Interpretation
Generally, an equity ratio exceeding 50% is considered excellent, while a ratio between 30% and 50% is considered good. The interpretation also depends on the industry in which the company operates.

Net debt-to-equity ratio
Description
The net debt-to-equity ratio describes the proportion of debt within a company’s financial structure. It indicates the relationship between debt and equity.
Interpretation
The higher the value of the ratio, the more indebted the company is. A company’s net debt-to-equity ratio is considered excellent if it is below 10%, good if between 10% and 60%, satisfactory if between 60% and 120%, fair if between 120% and 200%, and poor if above 200%.

Relative indebtedness ratio
Description
The relative indebtedness ratio is a financial metric that relates a company’s debt to its annual net sales—in other words, to the size of the company.
Interpretation
There are no absolute threshold values for interpreting the relative indebtedness ratio; instead, it should be viewed in relation to the company’s operating margins. The more profitable the company’s business, the higher its relative indebtedness can be. When the relative indebtedness ratio is close to zero, the requirement for EBITDA (operating margin) is also low.

Net financial expense ratio
(Net financial expense ratio)
Description
The net financial expense ratio indicates the proportion of net sales represented by ongoing financial expenses. The higher this proportion, the greater the company’s EBITDA requirements.
Interpretation
Good: under 20%; satisfactory: 20–29%; fair: 30–39%; poor: 40% or higher. Interpretation of the ratio depends on the company’s industry and capital structure. Changes in volume may cause significant annual fluctuations in the ratio. Large foreign exchange losses or gains can also cause volatility in the annual values of the ratio.

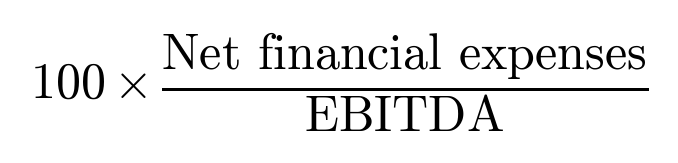
Net financial expenses / EBITDA
(Net financial expenses / EBITDA)
Description
The net financial expenses / EBITDA ratio indicates what proportion of a company’s EBITDA is consumed by ongoing financing costs payable to providers of debt capital.
Interpretation
Good: under 20%; satisfactory: 20–29%; fair: 30–39%; poor: 40% or higher.
Liability repayment period
(Liability repayment period)
Description
The liability repayment period indicates how many years it would take for a company to repay its liabilities using its financial result.
Interpretation
When interpreting this ratio, it is important to consider the structure of the liabilities and the company’s stage in its lifecycle. The shorter the repayment period, the lower the financial risk.
