Efficiency
Value added / personnel costs
Description
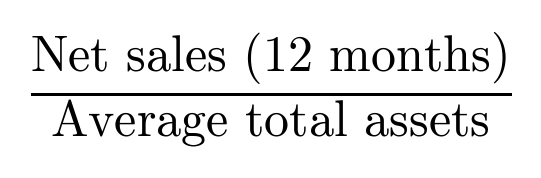
Value added represents the additional value a company generates for the goods and services it has acquired. As a key performance indicator, the ratio of value added to personnel costs measures personnel productivity—specifically, the amount of value created relative to the personnel costs incurred.
Interpretation guidelines
The higher the value of this ratio, the greater the employee productivity. A ratio of 1 indicates that the value generated is equal to the personnel costs incurred. A ratio below 1 suggests inefficient use of personnel, as costs exceeded the value generated. This ratio can also be used to assess the labor intensity of a company. It is a useful metric for drawing conclusions about a company’s labor intensity. The ratio varies by industry.
Working Capital
Description
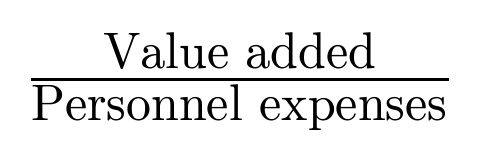
The amount of capital tied up in a company’s day-to-day operations. Working capital indicates the need for operating finance arising from business activities.
Interpretation
Generally speaking, the less working capital a company requires, the better. Consequently, the figure can also be negative—for instance, due to substantial advance payments.

Working Capital Ratio
Description
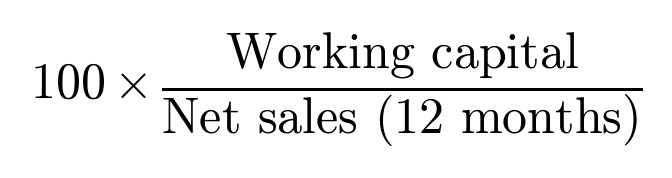
The working capital ratio indicates the amount of capital tied up in the company’s operations relative to the scale of those operations.
Interpretation
Relating working capital to net sales facilitates the comparison of different companies, as the amount of working capital depends on net sales. However, this ratio should only be compared across companies within the same industry.
Net Working Capital
(Net working capital)
Description
Net working capital indicates the proportion of a company’s financial assets and inventories financed by equity or long-term liabilities.
Interpretation
Net working capital shows the amount of long-term capital required to finance inventories and financial assets. As business operations expand, the need for net working capital increases; consequently, this ratio can be used to assess the company’s future financing needs.

Net Working Capital Per Turnover Ratio
(Net working capital per turnover ratio)
Description
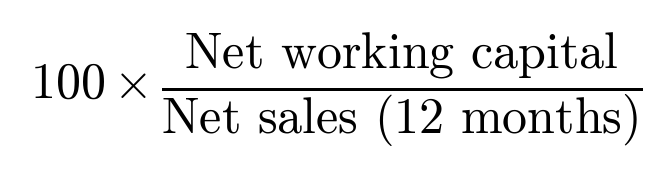
The net working capital percentage indicates the amount of net working capital relative to the scale of operations—specifically, net sales (turnover).
Interpretation
The net working capital percentage reveals the amount and type of capital tied up in the company’s business operations. This ratio enables comparisons between companies, though such comparisons are valid only among companies within the same industry.
Inventory turnover rate
(Inventories turnover rate)
Description
The inventory turnover period indicates the average number of days capital remains tied up in inventory (stock). This figure reflects the efficiency of a company’s manufacturing and warehousing operations—specifically, how long goods remain in storage on average.
Interpretation
The lower the figure, the more efficiently the company manages its materials and the less capital is tied up. The magnitude of this ratio depends on the industry and the nature of the company’s operations; for instance, service-oriented companies may not hold any inventory at all.

Sales receivables turnover
(Sales receivables turnover)

Accounts payable turnover
(Accounts payable turnover)

Capital turnover ratio
(Capital turnover ratio)
Description
The capital turnover ratio indicates how many times a company turns over its total capital in its business operations during a financial year. The average amount of invested capital is sometimes used as the denominator for this ratio; a ratio calculated in this way is known as the invested capital turnover ratio. The value of the ratio varies significantly by industry.