
Profitability
Gross margin ratio
Description
The gross margin ratio represents the portion of net sales that remains with the company.
Interpretation
Gross margin ratios vary by industry and depend on the company’s own competitiveness. There is no universal benchmark scale for interpreting the gross margin ratio; instead, it is influenced by the company’s cost structure. For example, software companies typically have higher gross margins than companies in the manufacturing industry.

EBITDA margin
Description
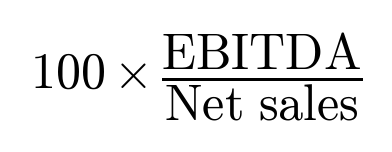
The EBITDA margin is a measure of relative profitability that is better suited for comparing different industries than the gross margin, as cost structures vary by industry.
Interpretation
The EBITDA margin represents the portion of net sales remaining after variable costs (such as wages and raw materials) have been deducted. When using the EBITDA margin, it is most meaningful to compare the growth of a company’s EBITDA margin over several financial years against that of its competitors.
Operating profit margin
(Earnings before interest and taxes, EBIT)
Description
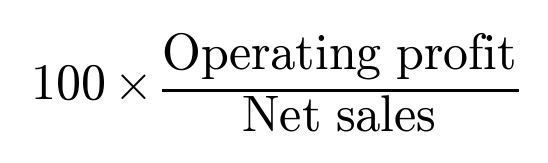
The operating profit margin is a profitability metric that represents the ratio of operating profit to net sales.
Interpretation
The operating profit margin is useful for comparing multiple companies and their operational profitability within the same industry, as financial items are excluded from the calculation. The more capital-intensive the company, the higher this percentage tends to be.
Financial result percentage
(Ratio of income before extraordinary items to turnover)
Description
The financial result percentage is a profitability ratio used to measure a company’s dynamic liquidity. It indicates the company’s ability to use the earnings generated from its core operations and regular ancillary business activities to repay loans and self-finance working capital and investments.
Interpretation
To maintain a state of stable growth, a company should be able to cover at least its loan repayments. As this figure is industry-specific and includes non-cash items—such as changes in inventory—examining actual cash flows provides a more realistic picture.

Net profit margin
(Net profit)
Description
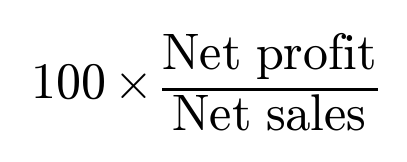
Net profit represents a company’s earnings after accounting for all expenses, excluding extraordinary items.
Intrepretation
The net profit margin is a useful metric for comparing companies within the same industry. When compared to competitors, a higher net profit margin indicates a company that is more profitable and manages costs more effectively.
Overall result percentage
(Overall result)
Description
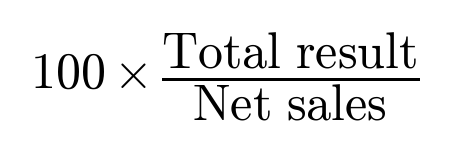
The overall result percentage represents the result of the company’s entire operations—as shown in the adjusted income statement—relative to net sales. The result includes extraordinary items.
Interpretation
Comparable to net profit. Extraordinary items can sometimes significantly impact profitability figures; for instance, a company operating within a group might otherwise show strong results, yet its net profit could suffer due to group contributions it has provided. This can create a misleading impression of the company’s actual liquidity and profitability.
Return on Equity
(Return of equity, ROE)
Description
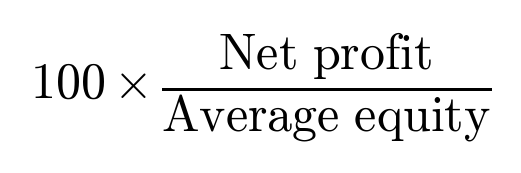
Return on equity is a profitability ratio that can be calculated in various ways, depending on the intended use and the objectives of the analyst.
Interpretation
It measures the ratio of net income to equity, thereby indicating the company’s profitability relative to the capital invested by equity holders. Rapidly growing companies naturally tend to have a higher ROE. A more reliable picture of the growth in a company’s ROE is obtained by calculating the average over a period of 5–10 years.
Return of investment
(Return of investment, ROI)
Description
Return on Investment (ROI) indicates the return generated on invested capital. It is one of the most widely used metrics due to its versatility and simplicity.
Interpretation
This metric aids in evaluating different investment options. If an investment option has a positive ROI—or an ROI higher than that of comparable alternatives—it is worth proceeding with the investment. However, ROI is also a metric that is easily manipulated and can be interpreted in various ways.

Return on Assets (ROA)
(Return of assets, ROA)
Description
A profitability ratio that measures the relative profitability of business operations. It indicates the proportion of earnings generated through the use of total assets.
Interpretation
ROA varies significantly depending on the company’s size and industry. Therefore, it is advisable to examine the trend of the company’s ROA figures over previous years and compare them with those of competitors. The higher the ROA, the better the profitability.
